
I recently described the emergence of hydroanalytic data platforms, outlining how the processes involved in generating energy from a lake or reservoir were analogous to those required to generate intelligence from a data lake. I explained how structured data processing and analytics acceleration capabilities are the equivalent of turbines, generators and transformers in a hydroelectric power station. While these capabilities are more typically associated with data warehousing, they are now being applied to data lake environments as well. Structured data processing and analytics acceleration capabilities are not the only things required to generate insights from data, however, and the hydroelectric power station analogy further illustrates this. For example, generating hydroelectric power also relies on pipelines to ensure that the water is transported from the lake or reservoir at the appropriate volume to drive the turbines. Ensuring that a hydroelectric power station is operating efficiently also requires the collection, monitoring and analysis of telemetry data to confirm that the turbines, generators, transformers and pipelines are functioning correctly. Similarly, generating intelligence from data relies on data pipelines that ensure the data is integrated and processed in the correct sequence to generate the required intelligence, while the need to monitor the pipelines and processes in data-processing and analytics environments has driven the emergence of a new category of software: data observability.
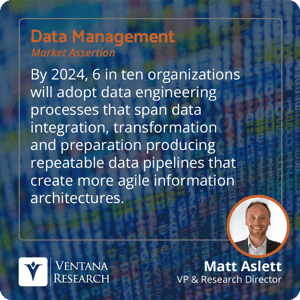 Just as a physical pipeline is used to transport water between stages in the generation of hydroelectric power, so data pipelines are used to transport data between the stages involved in data processing and analytics. The transportation of data has traditionally been a batch process that has moved data from one environment to another. However, data-driven organizations are increasingly thinking of the steps involved in extracting, integrating, aggregating, preparing, transforming and loading data as a continual process. Data pipelines enable data to flow through the organization, increasingly in an automated fashion that can be scheduled and monitored by data engineers without the need for constant manual intervention. We assert that by 2024, 6 in ten organizations will adopt data-engineering processes that span data integration, transformation and preparation, producing repeatable data pipelines that create more agile information architectures. Inspired by the observability platforms that provide an environment for monitoring metrics, traces and logs to track application and infrastructure performance, data observability software meanwhile provides an environment for monitoring the quality and reliability of data used for analytics and governance projects, as well as associated data pipelines.
Monitoring data quality is of course nothing new. It is a critical part of ensuring that data used for analytics and governance projects is fit for purpose, and data quality software has been extant for decades. While data quality software has historically provided users with an environment to manually check and correct data quality issues, data observability takes advantage of machine learning (ML) and DataOps to automate the monitoring of data used for analytics projects to ensure that it is complete, valid and consistent, as well as relevant and free from duplication. The use of artificial intelligence and machine learning (AI/ML) is critical to data observability in terms of expanding the volume of data to be monitored while also improving efficiency compared to manual data monitoring and management. While data quality is concerned with the validity and relevance of the data, data observability is also concerned with the reliability of the data, ensuring that it is available and up to date to avoid downtime caused by lost or inaccurate data due to schema changes, system failures or broken data pipelines.
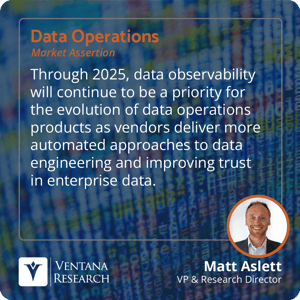
There has been a Cambrian explosion of data observability software vendors in recent years and while each is slightly different, they also have fundamental capabilities in common. In order to monitor and measure anything, it must first be instrumented, so a baseline requirement for data observability software is that it collects and measures data quality metrics from data pipelines, data warehouses, data lakes and other data-processing platforms. Data observability software also collects, monitors and measures information on data lineage (dependencies between data), metadata (describing the attributes of the data, such as its age, volume, format, schema), and logs of human- or machine-based interaction with the data. In addition to collecting and monitoring this information, some data observability software also enables the creation of models that can be applied to the various metrics, logs, dependencies and attributes to automate the detection of anomalies. Data observability software may also offer root cause analysis and the provision of alerts, explanations and recommendations to enable data engineers and data architects to accelerate the correction of any issues. The evolution of data observability is still in its early stages. In addition to the emergence of standalone data observability software specialists, we also see this functionality being included in wider data-operations platforms. This is a trend we expect to continue. We assert that, through 2025, data observability will continue to be a priority for the evolution of data operations products as vendors deliver more automated approaches to data engineering and improving trust in enterprise data.
 The relative immaturity of the market for data observability software means that it is difficult for organizations today to evaluate potential suppliers. Many of the emerging vendors are likely to be acquired while a few will fall by the wayside. That should not stop enterprises from evaluating the potential benefits of data observability, however, especially as it relates to automating data pipelines. While a lot of the focus in analytics projects is naturally placed on data platforms and analytics engines, I recommend that organizations should also consider the role that data observability has to play in evaluating the performance and reliability of their data pipelines, as well as the quality and validity of their data, to ensure that they are maximizing the benefit of their investment in data and analytics.
Regards,
Matt Aslett
Authors:

Matt Aslett
Director of Research, Analytics and Data
Matt Aslett leads the software research and advisory for Analytics and Data at Ventana Research, now part of ISG, covering software that improves the utilization and value of information. His focus areas of expertise and market coverage include analytics, data intelligence, data operations, data platforms, and streaming and events.